And yeah, if this is starting to sound like crazy talk I feel the same way. People tend to emphasize recent tragedies and forget about the (equally bad things) that happened in the past. Plus, I'm pretty sure there's always a group of people who want to think that they're living in the End of Days. Still, with global temperatures on the rise, there is the possibility that a hotter climate is fueling more severe storms.
So, can we put this to the test? Have the past few years had abnormally bad weather? I started trying to answer this question with the NOAA's Storm Prediction Center. They have archives of all the reported tornados that touched down in the US over the past 60 years. I wrote a quick web crawler to grab data from two separate time periods: 2000-2004 and 2010-2012. The 2000-2004 data will serve as a baseline and I will look to see if there are more torandos per year in the 2010-2012 set. Right off the bat I can tell you that I don't remember any bad tornados from 2000-2004 and I can name at least 2 from the more recent years (Joplin, MO and Tuscaloosa, AL). Let's see if I'm remembering recent disasters at the expense of older ones.
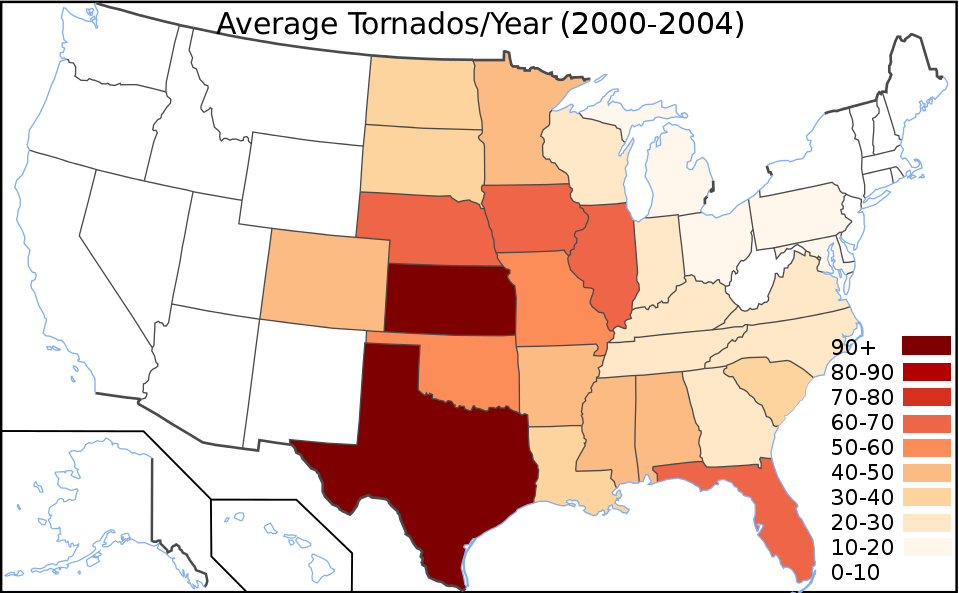
Below are two maps I made: the average number of tornados per year over the two time periods. Results are broken up by state.
 |
| These maps were made from the NOAA's Storm Prediction Center Archive. |
I also made maps of the strong tornados that occurred during these time periods. I classified a strong tornado as EF-3 or greater. These twisters are damaging enough to take the roof off your house at EF-3, but fortunately they are much less common. The next two maps show the average number of strong tornados per year and you can see that they're much less frequent than their weaker counterparts.

 |
| Average number of strong (EF-3 or greater) tornados per year. |
Ok, those two maps actually look different! Indeed, there were over twice as many strong tornados on average in a given year from 2010-2012. I'm also less tempted to dismiss the differences as due to a recent increase in storm chasers. My reasoning behind this is that these strong tornados are hard to miss. I would think it's much easier to miss out on an EF-0 twister in MiddleOfNowhere, Kansas than one of these monsters. Then again, I'm not a meteorologist, this is just an educated guess.
It's tempting to see this and shout "global warming is killing us all!" as you run back to your underground bunker that was deserted after December 22, 2012. But keep in mind these are very small numbers being compared over a very short time baseline. To make a better argument for climate change, I would have to go back and look at historical records from 50 years ago. Even if I did this, I'd still have to deal with the fact that mobile Doppler radar trucks and cell phone videos weren't around 50 years ago to document every tornado. I guess I'm stuck, but I did learn a few things (namely how to parse XML with python, and retrieve lots of data with an automated web crawler). This was kind of fun.